BrightScope and the Investment Company Institute publish an annual collaborative research report that analyzes plan-level data gathered from audited Form 5500 filings of private-sector defined contribution plans [“BrightScope Report”]. See https://www.ici.org/system/files/2021-07/21_ppr_dcplan_profile_401k.pdf or CLICK HERE. The annual report provides insights into plan design and trends and represents the most comprehensive data available to understand defined contribution plan fees. BrightScope has an express disclaimer that its report is for general information on fees and is not intended for benchmarking the costs of specific plans. But plaintiff lawyers often ignore this disclaimer and cite the report to support their excessive fee claims, and thus it is important to analyze the BrightScope data to evaluate how your plan compares.
This year’s BrightScope report, which was published in July 2021, analyzes plan data from 2018. It is based on a sample of 45,540 plans with $1.7 trillion in mutual fund assets, focusing on plans with 100 participants or more. No other study, even by large plan consultants, comes close to the comprehensiveness of the BrightScope analysis.
The following are the significant trends and statistics in the BrightScope report:
GENERAL STATISTICS:
- 21 Average Investment Options: In 2018, the average large 401(k) plan offered 28 investment options, of which 13 were equity funds, three were bond funds, and eight were target date funds. On average, large 401(k) plans (defined as plans with 100 participants or more) offer 21 options, if counting the target-date funds as one investment option. 42 percent of large 401(k) plan assets were held in equity funds; 28 percent were held in balanced funds (with most of that being held in target date funds); and 8 percent in bond funds. GICs and money funds account for 9 percent of assets.
- 84% of plans offer target-date funds: The use of target date funds has increased dramatically. In 2006, 32 percent of large 401(k) plans offered target date funds; this had risen to 84 percent of plans in 2018. Similarly, the percent of participants who were offered target date funds increased from 42 percent of participants to 82 percent between 2006 and 2018. The percentage of assets invested in target date funds increased from 3 percent to 25 percent. Participants in larger 401(k) plans tended to have less of their assets invested in target date or other balanced funds. For example, participants in 401(k) plans with less than $1 million in plan assets had more than half of their assets invested in balanced funds, compared with about one-fifth for participants in plans with $1B+ assets. The difference is largely based on 21.1% of assets in $1B+ plans invested in “other” investments, with most of the differential involving company stock investments.
- CIT assets are up to 33% overall and 49% of $1B+ plans: Mutual funds held 43 percent of large private sector 401(k) assets, and collective investment trusts (CITs) held 33 percent of assets, and 49% of all assets in $1B+ plans. This is a significant increase, because CITs typically have lower fees than mutual funds.
- Index funds are nearly universal in larger 401(k) Plans: 93.8 percent of large plans offer index funds and 98% of all participants are in plans with index funds. 98.7 percent of $1B+ plans offered index funds with 41.3% of the plan assets in index funds. More than 95 percent of large 401(k) plans with more than $10 million in plan assets offered index funds in their plan lineups in 2018, and 82 percent of large 401(k) plans with less than $1 million offered them.
- 41% of $1B+ asset plans are in index funds: Index funds make up a significant component of 401(k) assets, holding 36.9 percent of 401(k) assets in 2018. Index funds held a greater share of assets in larger plans, rising from 28 percent of assets in plans with less than $1 million in plan assets to 41 percent of assets in plans with more than $1 billion. This shows that most 401(k) plans have index fund options, and that over one-third of all assets (and over 40% for mega plans) are invested in index funds with lower fees than active funds.
RECORDKEEPER STATISTICS:
- Insurance companies were the most common recordkeeper type for 401(k) plans, and were more likely to provide recordkeeping services for the smaller 401(k) plans in the sample.
- Large plans use asset managers more often for recordkeeping services: Asset managers, including mutual fund companies, were the second most common recordkeepers across plans, but they were more likely to provide recordkeeping services for larger plans. As a result, asset managers provided the recordkeeping services for 32 percent of plans, but for 42 percent of participants and 57 percent of plan assets in 2018. More specifically, large plans are more likely to use asset managers as recordkeepers, with 62.4% of $1b+ plans using asset managers.
- 66% of 401(k) plans offered investment options that were proprietary to the plan’s recordkeeper, representing 25% of plan assets. 66% of 401(k) plans included investment options proprietary to the plan’s recordkeeper in their investment lineups, and those investments accounted for a little more than one-quarter of total plan assets in 2018. 7% of large plans offered proprietary funds from their recordkeeper, representing 27.0% of assets. The percentage of funds from recordkeepers is over 73% for plans between $100m and $1b.
TOTAL PLAN COST:
- The average total plan cost was 0.94% of assets, down from 1.02 in 2009. The average participant was in a lower-cost plan, with total plan cost of 0.60% of assets in 2018, down from 0.65% in 2009. The average dollar was invested in a plan with a total plan cost of 0.38% in 2018 (down from 0.47% in 2009).
- The average range of total plan cost is narrow for plans over $1 billion [between 0.15% to 0.45%]. 10 percent of plans had a total plan cost of 0.40 percent or less, while 10 percent of plans had a total plan cost of 1.54 percent or more. By contrast, on a plan-weighted basis, for plans with more than $1 billion in plan assets, that range is narrower, varying from 0.15 percent of assets to 0.45 percent, which is 50% lower than the average cost for all plans.
- The average investment cost for $1B+ plans is .36%, compared to .69% for <$1m plans. The average asset-weighted expense ratio for domestic equity mutual funds (including both index and actively managed funds) was 0.69 percent for plans with less than $1 million in plan assets, compared with 0.36 percent for plans with more than $1 billion in plan assets in 2018. The primary reason that large plans have a lower total cost is that a greater share of their assets are invested in index funds.
Total Plan Cost by 401(k) Plan Assets
| Size of Plan | Total Plan Cost on an Asset-Weighted Basis | Total Plan Cost on a Plan-Weighted Basis |
| Less than $1m | 1.44 | 1.44 |
| $1m to $10m | 1.05 | 1.12 |
| $10m to $50m | 0.76 | 0.80 |
| $50m to $100m | 0.61 | 0.62 |
| $100m to $250m | 0.46 | 0.47 |
| $250m to $500m | 0.42 | 0.42 |
| $500m to $1B | 0.37 | 0.37 |
| More than $1B* | 0.24 | 0.29 |
| All plans | 0.38 | 0.94 |
*note that 56% of all plan assets are in $1B+ asset plans
MUTUAL FUND EXPENSE:
- The asset-weighted average expense ratio for index mutual funds in 401(k) plans was 0.08 percent of assets, compared with 0.42 percent of assets for domestic equity mutual funds (including both index and actively managed funds). Index funds also have lower expense ratios in larger plans. For example, index funds in plans with less than $1 million in plan assets had an average expense ratio of 0.18 percent of assets, compared with 0.06 percent in plans with more than $500 million in plan assets.
- 10 percent of assets were invested in funds with expense ratios of 0.04 percent or less, and 10 percent of assets were invested in funds with expense ratios of 0.90 percent or more.
From our perspective, this is the key chart in the BrightScope report:
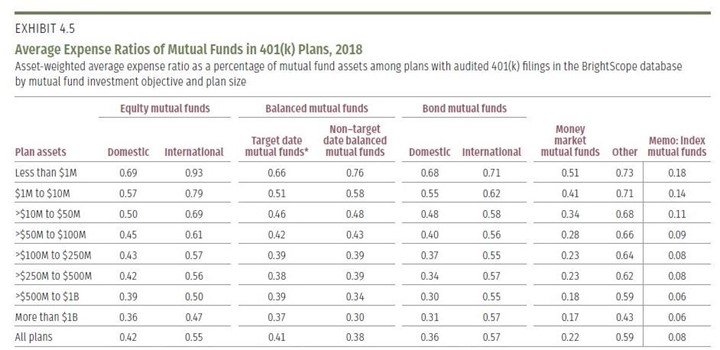
This chart shows that the fees in plans go down as the asset size goes up. Plans with $500m and more assets have lower fees [.36-.39% for domestic equity funds; .37-.39% for target-date funds; and .06% for index funds]. The prime reason is that they offer low-cost index funds at an average of 8 basis points.
THE EUCLID PERSPECTIVE:
We think two key conclusions can be drawn by the BrightScope report that are lost in the avalanche of excessive fee cases. First, large plans have dramatically lower fees than small plans. And second, nearly every large plan offers a low-cost index fund in the investment lineup, allowing participants to contain their investment fees.
Conclusion #1: Large plans have dramatically lower fees than small plans. If you work for a large company in America, you likely have significantly lower fees in your 401(k) plan. Understanding the fact that large plans have low fees is crucial for perspective in the excessive fee cases. The reason is that plaintiff firms cast their work in Robinhood-like fashion, claiming that they are helping participants restore losses caused by their employer fiduciaries who fail to rein in the retirement industry. Time after time, judges fall for this disingenuous premise and allow cases to move to the discovery phase in which plaintiff firms unfairly leverage their discovery burdens and astronomical damages models. Judges want to help participants, but they lack the perspective that this BrightScope survey demonstrates. If the premise of an “excessive fee” case is that the large plan fiduciaries failed to leverage their size to control plan expenses, this survey debunks this premise for most large plans.
Conclusion #2: Nearly every large plan offers at least one low-cost index fund to give participants the ability to reduce plan costs.
The other key point is that nearly every large plan offers a low-cost index fund in the investment lineups, and 41% of mega-plan assets (over $1B) are in low-cost index funds. Given that the S&P 500 index fund is usually offered for miniscule fees of .005% to .02% for most mega plans, participants in most plans in America have the ability to limit their expenses to less than 2 basis points by investing in America’s best corporations, which has been a great investment for the last two decades. This is the exact investment that Warren Buffett has advised for years, and it is nearly free for most large plan participants. Plaintiff firms try to contend that certain active investment options in these plans are imprudent, but the simple fact remains that participants in nearly every plan can choose investment options with minimal fees. They don’t have to choose the higher fee investment options.
This is a key issue in the pending Northwestern case – maybe the most important issue, but certainly the issue that is missing from every analysis that we have seen about the case. The Department of Labor took the position in its amicus brief that plan fiduciaries cannot rely on a mix of low and high-cost investments. DOL stated that under the law of trusts, “fiduciaries are not excused from their obligations not to offer imprudent investments with unreasonably high fees on the ground that they offered other prudent investments.” DOL contends that fiduciaries cannot include a reasonable array of options that includes some good ones, and then “shift” the responsibility to plan participants to find them. But this is why the Northwestern case is so dangerous. The Northwestern plan had 129 retail share class investments with higher fees, and only some revenue sharing to justify part of the fee differential. That is not the case for most large plans. Most plans have low-cost index funds and some higher-cost active funds – all within an average of 21 investment options as shown by the BrightScope report [in contrast to the 200+ options that were allegedly confusing to Northwestern participants]. This should be a reasonable mix and courts should not allow the burden and exposure of an excessive fee case, unless the fees are disproportionately higher than the benchmarks. All 21 investments should be analyzed in the context of the entire portfolio, not in isolation. With proper legal standard and perspective, this should keep most plans off limits for excessive fee litigation.
The Juniper Networks “Excessive Fee” Case: A good example to study is the particularly feeble case recently filed by the Walcheske & Luzi, LLC in Reichert v. Juniper Networks, Inc., Case 3:21-cv-06213 (N.D. Calif.). Plaintiffs complain about two isolated investments in the plan, and claim that the plan fiduciaries should pay millions of dollars of damages. Specifically, they claim that the AB Discovery Value Z Fund at .79% is imprudent, because the A series of the shares at a higher 1.13% fee had .50% of revenue sharing for a net of .63%; and that the Fidelity Total Bond Fund at .45% with .10% of revenue sharing for a net cost of .35% is imprudent, because they should have picked the higher fee M series with a higher fee of .75%, but a net of .50% with .25% revenue sharing. Any absurd allegation that plans should select high revenue sharing share classes demonstrates that this law firm has no understanding of proper fiduciary management. Indeed, a problem with revenue sharing is that the burden of recordkeeping is paid unequally by participants who chose the revenue-sharing investments. But assuming that these claims are not laughed out of court, as they should be, the point we want to focus on here is that plaintiffs make no effort to describe the totality of the investments in the plan, or even how much is invested in these two isolated investment options. They should not be allowed to cherry-pick two investments out of several dozen in the plan. Anyone with an internet browser can look up the Juniper Networks, Inc. 401k plan Form 5500 on the DOL website. Based on our review of the 2019 Form 5500, which the plaintiffs used to allege high recordkeeping fees [based on distorted data that includes more than just recordkeeping fees – but that is matter for another day], the plan has 44 investments of 10 basis points (.10%) or lower; and 14 of these low-cost investments are just 2 basis points (.02%). One can quibble that the number of investments is too high, but the fact remains that plan participants had 44 choices of low-cost investment options! The Walcheske & Luzi law firm knows that the plan has dozens of low-cost investments, but somehow has the temerity to seek millions of dollars of attorney fees by challenging two allegedly high-cost investments – investments that participants would have to work hard to choose when inundated with so many low-cost investment choices. We can continue to treat American workers – the same workers who vote in our elections – as incapable of choosing whether they want the low-cost index or higher-cost active investments, but we hope the judge assigned to this case is not so easily fooled. The bottom line is that plans with super low-cost index funds should start with a presumption of prudence. But what is happening in excessive fee cases like Juniper Networks is that plaintiffs are cherry-picking a few investments and asking for a presumption of imprudence. Judges need to flip this playbook, because ERISA was never designed to allow indiscriminate, vigilante litigation like the Juniper Networks case.
In conclusion, perspective on plan fees matters because judges continue to be fooled by plaintiff firms who contend that they are serving as private attorney generals. They purport to keep down retirement plan fees when plan fiduciaries are “asleep at the wheel,” and allow retirement plan providers to charge unfair expenses to plan participants. But except in some cases with egregious fees, this is a big con. As the BrightScope Report shows, most large plans have low investment fees, and afford participants the ability to contain their investment fees to a minimal amount with quality index options. As we will continue to insist until judges start hearing us, the standard in excessive fee cases needs to require egregious fees that are disproportionately higher than reliable benchmarks. Plaintiff firms should not be allowed to sue over minor differences in fees; and should not be able to sue plans over investment fees when low-cost index funds are offered as reliable alternatives for cost-conscious participants.